

My Notes On The Oil Industry
My Notes On The Oil Industry

Any serious investor is always keeping an eye on the market.
In a recent Fantom Unchained episode the crew touched on the profitability of the oil companies.
If you haven’t seen the episode here is my recap. 👇

In this post I’m looking at the profitability of the top 10 companies in the integrated oil industry. I will go in the following order:
Structure of the industry
Crack spread
Top 10 most profitable companies (Sales, Ebitda, Net income)
Disclaimer: Any views expressed in the below are the personal views of the author and should not form the basis for making investment decisions, nor be construed as a recommendation or advice to engage in investment transactions.
Structure of the industry
Before we begin it’s important to understand what is what.
The industry is split into three phases.
First, there are companies that deal with the exploration and initial production stages (upstream).
Then there are companies whose main activities include the processing, storing, transporting, and marketing of oil, natural gas, and natural gas liquids (midstream).
Finally the oil and gas needs to be converted into the finished product and there are companies that are doing that (downstream).
I will be looking at the integrated oil companies.
Definition by McKinsey: Integrated oil companies are ones that play across the entire petroleum value chain from oil exploration and production (upstream) to transport, refining, and marketing (downstream).
What’s a crack spread? Let’s crack it
Nick Drakon mentioned Crack Spread as one of the key metrics when looking at the oil and gas industry.
I think it’s good to mention it and give a brief explanation of what it is.
The most basic definition would say that it’s the overall pricing difference between a barrel of crude oil and the petroleum products refined from it.
It’s a way to estimate the profitability of the refining sector. In simple terms you compare the prices of crude (the raw material) to the prices of the end product - gasoline and diesel.
There are a few ways to calculate the crack spread.
A common approach is to use the 3-2-1 crack spread - the difference between the cost of three barrels of crude and the sum of two barrels of gasoline plus one barrel of diesel.
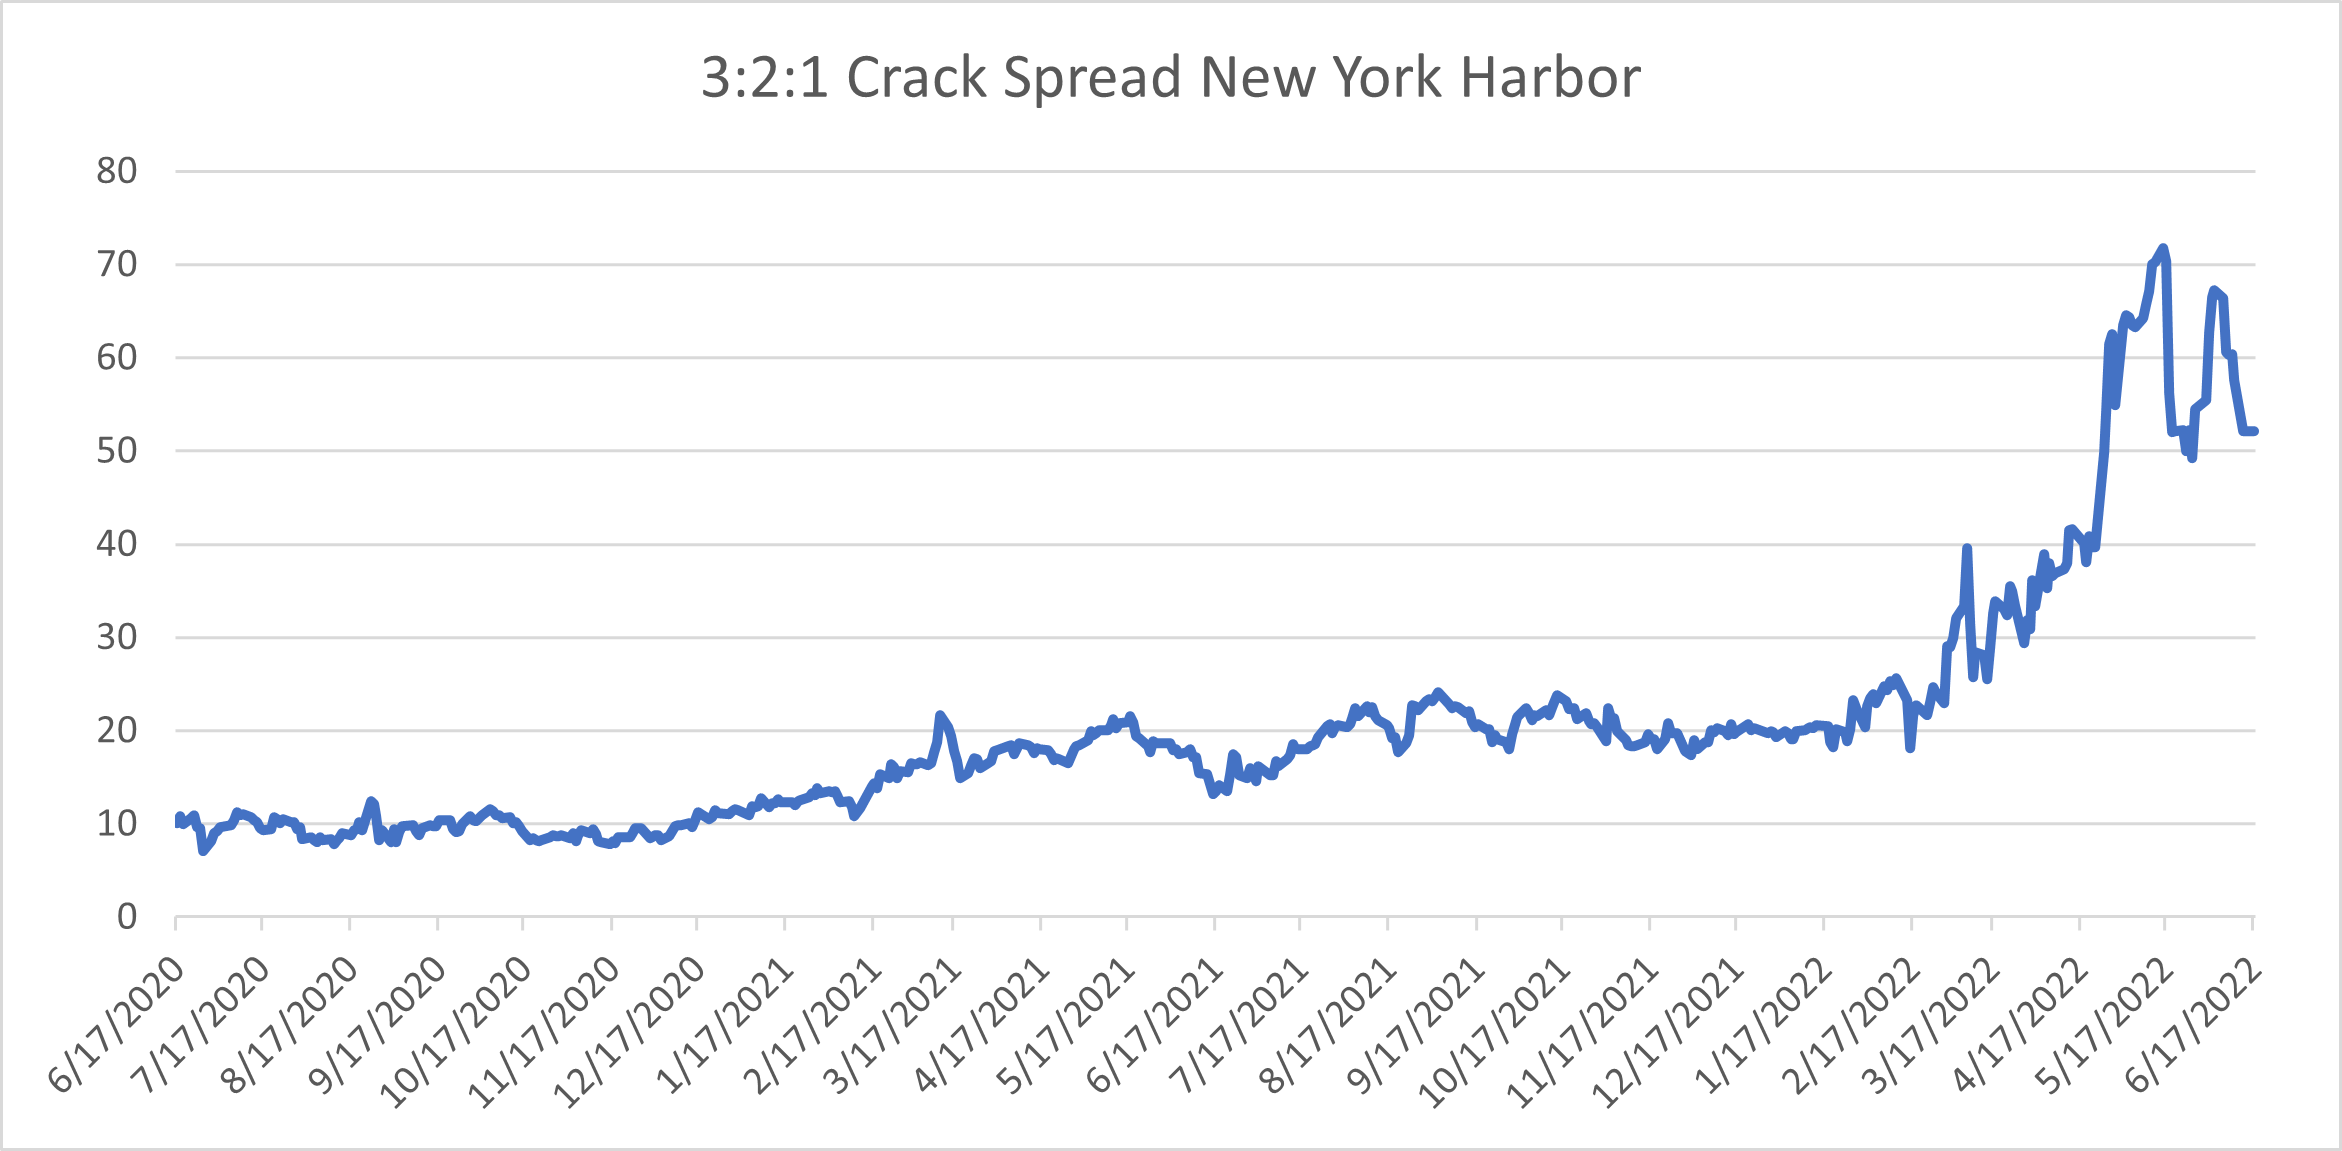
Crack spreads have sky-rocketed
Below you can see a chart of 3:2:1 Crack Spread New York Harbor.
Before 2021 the spread was around $10, then it went up to $20, and now it’s $50+.
Who is making the big bucks?
I looked at the top 10 companies by market cap globally in the integrated oil industry.
And I pulled the quarterly data for Sales, EBITDA and Net Income for the latest quarter and four quarters ago. Latest quarter reports are dated March 31st, 2022.
The top 10 companies are the following:
Saudi Arabian Oil Co.
Exxon Mobil Corporation
Chevron Corporation
Shell PLC
PetroChina Company Limited
TotalEnergies SE
Gazprom PJSC
Equinor ASA
BP p.l.c.
Petroleo Brasileiro SA Pfd
The data for the median figures for the top 10 companies are the following:
Latest vs -4Q
Sales: $194,250 bn vs. $137,176 bn (+42%)
EBITDA: $53,511 bn vs. $20,741 bn (+158%)
Net Income: $21,055 bn vs. $-3,703 bn (n/a)
The data for the top 3 companies:
Saudi Arabian Oil Co.
Sales: $458,128 bn vs. $234,044 bn (+88%)
EBITDA: $262,305 bn vs. $129,889 bn (+102%)
Net Income: $122,263 bn vs. $53,301 bn (+129%)
Exxon Mobil Corporation
Sales: $312,715 bn vs. $182,336 bn (+72%)
EBITDA: $57,778 bn vs. $20,810 bn (+178%)
Net Income: $25,790 bn vs. $-19,100 bn (n/a)
Chevron Corporation
Sales: $178,128 bn vs. $96,508 bn (+85%)
EBITDA: $40,193 bn vs. $13,990 bn (+187%)
Net Income: $20,507 bn vs. $-7,765 bn (n/a)

As always I’m leaving the interpretation of this to you. I simply was curious of how the financials look for these companies.