

Weekly Technical Analysis
Weekly Technical Analysis
The calm before the storm?

VIX is dropping.
The DXY has set itself up to continue up while S&P 500 is moving into a confluence of resistance areas.
From the first look it might seem that the market is recovering, however, I would be very careful.
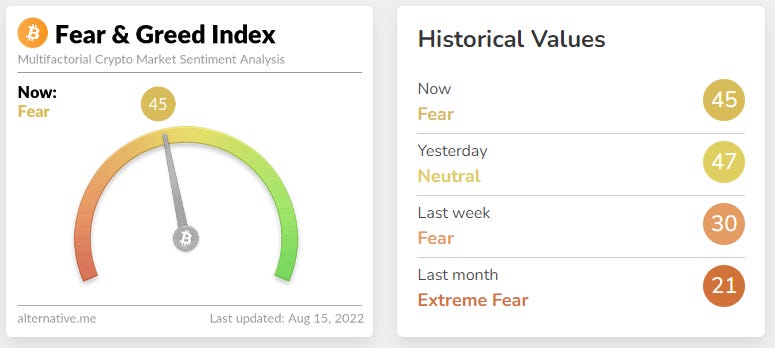
Fear & Greed index is moving higher meaning that people might start to get fomo.
BTC is already looking weak and seems like the perfect spot to get dumped on.
DXY
DXY has retraced back to the S area. Double wicks to me indicate weakness towards the downside (price action is more likely to go up). Price is well above the 200 MA.
Daily Chart

VIX
VIX is dropping.
Daily Chart

SPX
SPX has smashed through the R area. Also, it’s above the 50% retracement from the top and moving towards 61.8% retracement. About to touch the 200 MA which often acts as a support / resistance.
If our long term view on the market is bearish, from a technical perspective it seems like a good place to start looking for shorts.
However, if we believe that the trend can continue up we have the R area that has now turned into S area acting in our favor.
I would want to see the price testing it before thinking of taking any action.

BTC
BTC is well below the 200 MA. It’s consolidating at the R area which coincides with the 50% retracement from the most recent top.
There are a lot of wicks at the top and to me this indicates weakness to the upside. From a TA perspective it’s hard to find arguments to go long here.

Fear & Greed Index
This is not, in any way, financial advice and should never be considered as such. I will not be held accountable for any trading decisions that you or others make.